
Partner
Client project
Case study16
React-based enterprise platform for waste management analytics with interactive data visualizations

Partner
Client project
Industry
Environmental & Recycling
Core technologies
React · TypeScript · Tailwind CSS
At a glance
DuoByte built the frontend of a waste management analytics platform with React and TypeScript. Companies explore their waste data in interactive charts, open reports and track their sustainability goals. An admin dashboard with user management and a document upload interface complete the analytics.
Our role: Frontend development of the web application in React and TypeScript, including data visualization, the admin dashboard and document upload.
Project work
How the project came together: from the context and requirements through implementation to where it stands today.
Context
For companies, waste management is not only about disposal but also about data. Only by analyzing waste data over a longer period can a company see where processes can improve and whether its sustainability goals are within reach.
The platform DuoByte built the frontend for is designed for exactly this kind of analysis. It presents companies with their waste data as charts and reports and highlights trends that decisions about waste management can be based on.
Challenge
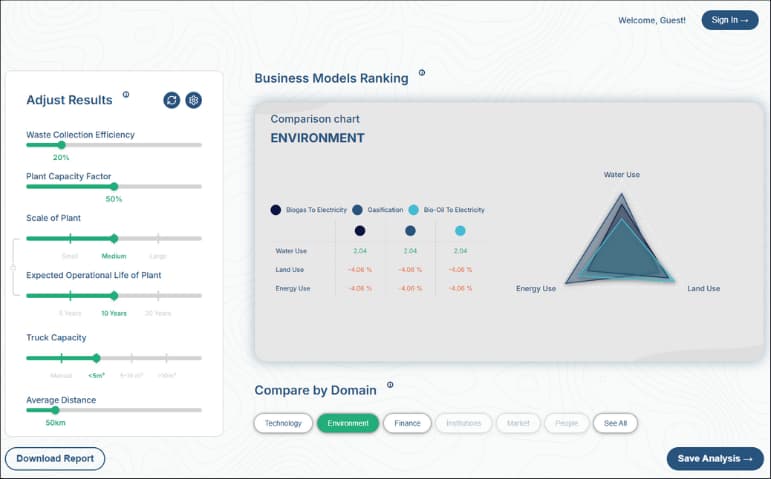
Waste data has many dimensions: it spans different processes and often only becomes meaningful over time. Raw values in a table are of little use day to day. The platform needed an interface that prepares this data so trends become visible without additional analytics tools.
At the same time, the platform is more than a chart viewer. Administrators manage users, and relevant documents have to get into the system securely. The frontend had to bring these tasks together in one application without cluttering the analytics.
Solution
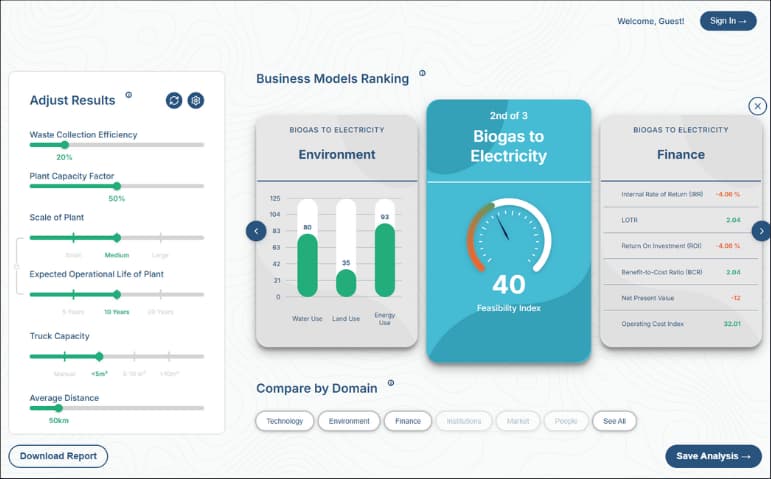
Analytics are at the center: interactive charts show a company's waste data and make changes over time visible. Detailed waste management reports and progress toward the company's sustainability goals are available in the same application.
An admin dashboard and an upload interface support the operation of the platform. The feature set at a glance:
Implementation
The frontend is built on React and TypeScript. Typing makes the data structures passed between components and charts explicit. When the format of a record changes, the compiler points to every affected place before the mismatch surfaces in the browser.
Visualizations use Recharts, a library that provides charts as React components. Charts therefore follow the same component logic as the rest of the application and are driven by typed data instead of being embedded as a separate script.
The layout is implemented with Tailwind CSS and is fully responsive. The modular component architecture separates reusable building blocks from individual views, so new analyses and sections can be assembled from existing components.
Outcome
With the platform, companies have one place to analyze their waste data, review reports and track progress toward their sustainability goals. Administrators manage users in the same system, and documents reach the platform directly through the upload interface.
Thanks to the modular structure, the application can be extended with further analyses and views without rebuilding existing sections. TypeScript keeps such extensions traceable, even when other developers work on the code later.
Product & context
Selected views show how the system was conceived and implemented within its domain context.
System architecture
Technologies were combined to suit the task, operating model and long-term maintainability.
Related services
Keep exploring
Next case study

Your project
Tell us what your system needs to do. We bring structure to requirements, architecture and delivery.